search
Most plan documents have an associated progress report. Progress reports are a very powerful tool to help track a student’s progress toward their goals/objectives as stated in their plan. Progress can be tracked narratively, through observation and comments, or with a progress monitoring chart if there are student scores to report.
Progress reports will automatically populate with goals/objectives (as well as plan dates) from the most recent, completed, plan document. When you create a progress report, if the goals/objectives do not populate automatically, or if they are from a past plan document, you can complete the current plan document, then click Update Goals/Objectives in the progress report document to re-pull the information.
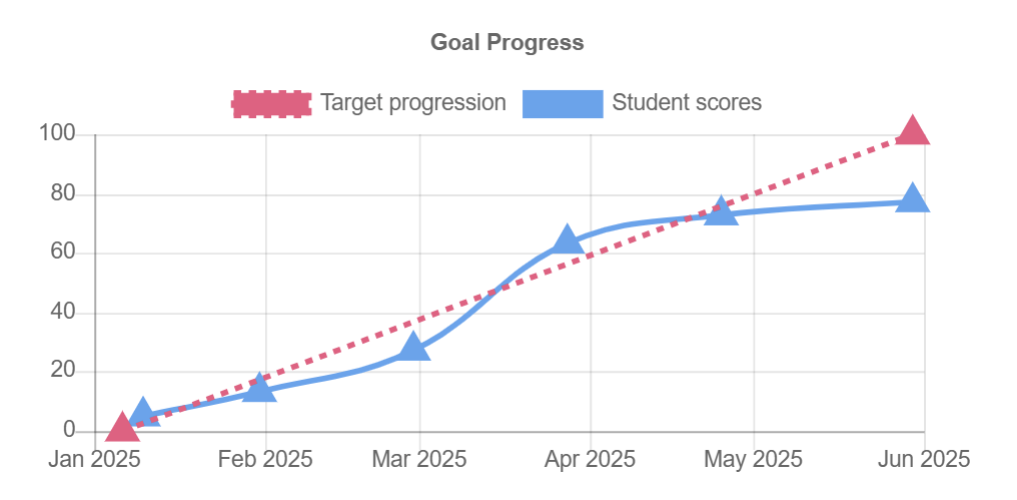
Within most progress reports, you can create progress monitoring charts. These charts provide a great visual representation of a student’s actual progression as compared to their target progression throughout the year, which can be especially helpful when discussing a student’s progress with parents. In addition to tracking whether or not a goal has been met, you are able to tell if a student is on track to meet their goal by the end of the year or the reporting period.